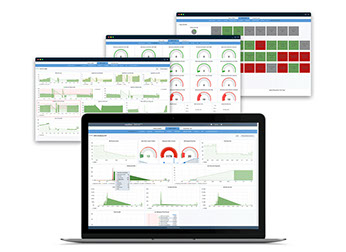
Managing your enterprise systems becomes challenging when you have a significant number of systems and KPIs to track, when you undergo a merger, acquisition, or consolidation, when you implement a new system, and when you open a new business unit or location. TrendZ demystifies performance monitoring by historically trending all of your business-critical KPIs and displaying them together through a single pane of glass, so you can seamlessly identify and resolve issues before your end users do.
Historic Data Views
Save IT staff hours, cost, and reduce downtime and redundant issues.
Avoid information overload by only displaying very specific data in one place from where you can decisively identify the root cause of an issue and determine the best corrective action to take.
Utilize historic data to understand the cause of an issue and determine the effectiveness of your tuning, ETLs, etc.
Built-in Log Parser
Save DBAs and Administrators time by automating the process of checking all alert logs for errors and highlighting only the important ones.
Supported Log types
Concurrency Monitoring
Holistically monitor concurrent requests from a single screen to troubleshoot and track your workload with ease. Each graph can be filtered by duration to identify long-running jobs across any period of time.
Live SQL Tuning Pack
Smart Alerts
Customize, integrate, and eliminate noise. TrendZ's built-in protocol plugs into your communication and incident management tools, so you can customize and send alerts to the right personnel at the right time.
Example Alerts
Month-End Reporting
Track KPIs and business processes critical to your month end or period close process to measure system performance and understand any deviation that occurs over time. Graph the minimum, maximum, average, and current time a program has taken to run to rapidly resolve or tune any potential issues before the end user reports it.
Example business activities and processes
Capacity & Storage Insights
User Activity & Adoption
Visualize daily user activity and active user count to understand adoption and utilization worldwide. Drill down to capture the user experience, performance issues impacting system utilization, or to decide whether to retire underutilized legacy systems.
DBA and IT development analytics are simplified and displayed via an easy-to-use presentational layer.
TrendZ provides intuitive database, storage, hardware, and infrastructure metrics to help Database and Systems Administrators focus on more strategic projects, rather than time-intensive maintenance and issue troubleshooting tasks.
TrendZ gives IT management and operations objective measurements that help reduce resource requirements, IT infrastructure costs, operational expenditures, and Total Cost of Ownership (TCO)
Monitoring Server Requirements
1 CPU & 4-8 GB RAM
25 GB Disk for 1-year of growth
TrendZ can be run as an Agent or Cron (TrendZ uses CURL and HTTP POST, so no utilities are required for Cron scripts).
Installation & Setup
ennVee will handle the installation and setup to minimize implementation time. After installation is completed, we train your users on how to use and customize TrendZ to configure alerts, show specific data, and anything else specific to your requirements. Canned graphs can be ready to use in approximately 3-4 hours and custom graphs can be developed in less than 10 minutes/each.
Hosting & Deployment
Cloud Hosting & Deployment
TrendZ is hosted and run from ennVee's Oracle IaaS Cloud
On-Premise Hosting & Deployment
TrendZ is installed on one physical server. Installation and setup is handled by the ennVee team.